

Representative Case Study — This case study adapts a proven executive-performance and KPI-governance methodology to a multi-location retail and service organization. The business context is representative; I intentionally excluded proprietary systems, organizational identities, customer information, and sensitive operating data.
Executive Summary
A multi-location service enterprise had extensive performance data across sales, customer experience, staffing, quality, productivity, and operations. The main challenge was not a lack of reports, but enabling leadership to identify which operational changes truly affected business outcomes.
I implemented an executive performance framework that organized complex metrics into a clear hierarchy of top-line outcomes, leading indicators, and diagnostic details. This approach improved oversight and enabled leaders to move quickly from general inquiry to targeted action.
The Challenge
Although each location produced valuable performance data, leadership reviewed metrics in isolated silos and separate reports.
Executives tracked individual indicators such as revenue, customer satisfaction, staffing, productivity, service quality, and compliance, but struggled to see how these factors connected. For example, a decline in customer experience could result from labor shortages, process bottlenecks, increased regional volume, or service delays.
The main challenge was to reduce report sprawl and complexity without oversimplifying the business’s operational realities.
Context
The organization operated across diverse locations, each with unique volume profiles, labor structures, customer demand, local conditions, and operational maturity. Leadership needed a global perspective while understanding that similar metrics could result from different root causes at each site.
Effective executive performance architecture relied on four foundational pillars:
- Consistency: Standardized definitions and measurement criteria across the enterprise.
- Context: Granular visibility to explain regional variance.
- Focus: Concentrating on signals that significantly impact business outcomes.
- Drill-Down Capability: A clear path from executive summary to supporting root-cause evidence.
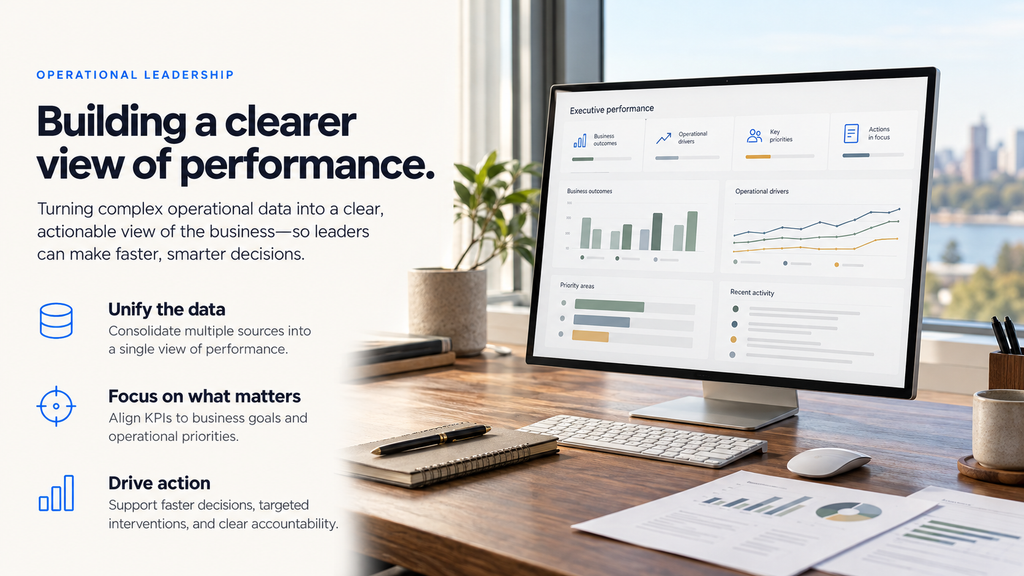
Dashboard concept. Data, metrics, and site names are simulated for portfolio display.
What the Data Showed
Baseline diagnostics showed that teams often viewed performance metrics separately, despite their close links.
Sites with similar headline results often conceal different operational issues. For example, low customer satisfaction at one location stemmed from staffing shortages, while the same issue elsewhere stemmed from process failures or service delays.
The data showed that executive reports should highlight causal links between measures instead of adding more KPIs to dashboards. Tracking trends and exceptions is more valuable than reviewing static summary figures.
Approach
I based the architecture on the decisions that executive leadership needed to make. Instead of beginning with a generic list of metrics, I focused the design process on core investigative questions:
- What changed across the enterprise?
- Where is the variance concentrated?
- Is the shift an isolated anomaly or a sustained trend?
- Which operational conditions fuel the movement?
- Who holds the accountability to act?
I organized metrics into a clear three-tiered hierarchy: Executive Outcomes (high-level business performance indicators), Supporting Indicators (operational signals explaining outcome variance), and Diagnostic Detail (granular data by location, team, and process for in-depth analysis). This structure created a direct link between strategic oversight and operational insight.
Solution
The performance-intelligence framework consolidated key business metrics into a unified, decision-focused command center. Executive dashboards highlighted the most impactful signals:
- Current performance baselines;
- Directional trend trajectories;
- Exception flags and anomalies;
- Cross-location comparative benchmarks;
- Material performance shifts;
- Core supporting operational indicators.
When a metric exceeded expected thresholds, leaders could immediately investigate specific sites, teams, or operational areas to identify root causes. The architecture prioritized actionable signals over data volume, guiding executives directly to areas needing attention and providing clear supporting evidence.
Implementation
I deployed the framework in stages through regular executive performance reviews, starting with rigorous validation of metric definitions to ensure consistent application across all locations.
I continuously refined dashboard views to address leaders’ key questions during operational reviews. I removed low-value indicators or moved them to detailed diagnostics, while prioritizing high-impact metrics for visibility.
The reporting structure is now integrated into the organization’s operating rhythm, providing a unified analytical framework for weekly syncs, monthly reviews, and strategic planning.
Results
The new performance framework provided a unified view of operational health, eliminating the need to reconcile disconnected reports.
Leaders can now seamlessly trace enterprise-level metrics to local drivers, accelerating decision-making and directly connecting executive strategy to frontline execution. This clarity makes it easy to distinguish isolated anomalies from broader systemic trends.
Most importantly, the model establishes a resilient management foundation, designed to adapt naturally as business priorities and conditions change.
Lessons Learned
Executive reporting should not focus on maximizing data density or displaying every metric. Its value lies in highlighting critical signals, maintaining consistent definitions, and creating an experience that enables timely action.
This initiative reinforced an essential design rule for all performance intelligence work:
Begin with the decision in mind. Identify exactly what leaders need to know, determine the evidence required to support their judgment, and organize information so users move easily from key signals to detailed explanations without added complexity.