

The response-timeliness rate increased from 99.54% to 99.58%, while complaints marked as not timely rose from 655 to 741 during the same period.
Showing only the percentage on a performance slide may seem reassuring, but including the count changes the discussion. It remains necessary to determine whether the additional exceptions require attention, where to focus, and what would justify operational changes.
This analysis is based on a saved extract from the Consumer Financial Protection Bureau’s Consumer Complaint Database. The file contains 478,794 complaints received during January–March 2024. It is a historical example, not a current industry benchmark or a client case study.[1]
These figures provide a useful test for KPI review meetings: can the team explain an improving rate without overlooking a rising number of exceptions?
The percentage needs the full complaint count
The CFPB’s field reference defines “Timely response?” as whether the company responded in a timely manner.[2] Here, the Yes rate is the number marked Yes divided by all complaints received in the same month.
These are received-month groups. March’s figure does not indicate when responses occurred, and the flag does not specify response time in hours. It also does not reflect customer satisfaction or complaint resolution.
January included 143,365 complaints, with 655 marked No. March included 177,815, with 741 marked No. Complaint volume increased by 24.03%, while the No count rose by 13.13%. Because total complaint volume grew faster than the No count, the No rate declined and the Yes rate improved by 0.04 percentage points. February’s Yes rate was slightly higher than March’s, indicating the improvement was not continuous.
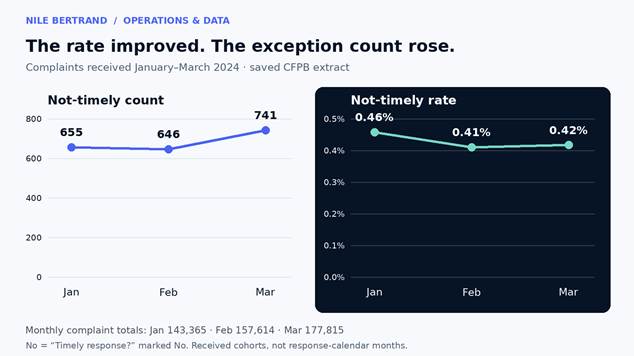
Figure 1. An improving proportion can accompany more exceptions. Each rate uses all complaints received in that month. The panels have separate, zero-based scales; they do not imply a shared unit. Source: original analysis of the saved CFPB extract.
Both figures should be included in the review. The rate shows how common a No flag was among complaints, while the count reflects the volume of exceptions. Neither indicates the effort required for each exception. An increase in exceptions warrants further review but does not confirm a staffing shortage or reduced productivity.
A product can improve and still need more attention
Debt collection illustrates this tension clearly. Complaint volume increased from 7,175 in January to 12,354 in March, a 72.18% rise. During this period, the No count grew from 166 to 260, while the No rate declined from 2.31% to 2.10%.
A review focused only on the declining rate would overlook the increase in exception volume. Conversely, reporting only the count could imply worsening proportional performance when the opposite is true.
The next step is to identify where the additional No flags occurred. Breaking down results by company, issue, or submission channel could reveal concentration in specific process areas or changes in complaint mix. However, this product-level result cannot distinguish these factors, and it would be premature to recommend intervention based solely on this evidence.
At this stage, leadership judgment is needed to select which investigation to pursue before deciding on potential solutions.
Small categories can carry a large share of exceptions
The overall result is heavily influenced by credit reporting or other personal consumer reports. That category accounts for 83.57% of the complaints in the file and has a No rate of 0.13%.
Student loans represent only 0.87% of complaints but account for 20.62% of all No flags. Their No rate is 10.12%, with 421 No flags among 4,162 complaints. This concentration could be overlooked in reviews focused on the largest intake categories.
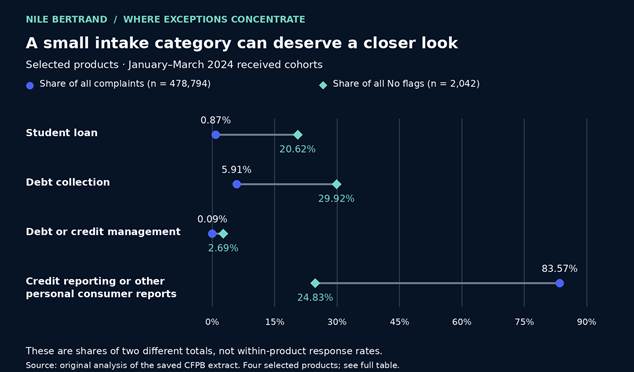
Figure 2. These are two shares, not two response rates. Blue dots show each product’s share of all 478,794 complaints; aqua diamonds show its share of all 2,042 No flags. Four selected products illustrate the contrast; the complete product table accompanies this draft. Source: original analysis of the saved CFPB extract.
Prioritization depends on the review’s objective. Debt collection has the highest No count for the quarter, with 611 among 28,301 complaints. Debt or credit management has the highest No rate at 12.14%, representing 55 No flags among 453 complaints.
These findings support different investigative approaches but do not determine which product poses the greatest risk to customers. The file lacks data on customer or transaction volumes, complaint severity, and resolution costs. The CFPB also notes that complaints are not a representative sample of consumer experiences.[1]
Give the meeting a decision it can support
The opening of “The Five Traps of Performance Measurement” by Andrew Likierman highlights the challenge of metrics and comparisons that offer limited insight.[3] This example demonstrates how a favorable headline can leave key decisions unresolved.
For this review, I recommend commissioning focused investigations into debt collection and student loans. Debt collection merits attention due to its exception volume and changing intake, while student loans require review for their disproportionate share of No flags. Neither finding identifies the underlying cause.
The person commissioning this work should assign an owner, set a return date, and define the evidence required to support a process change. Follow-up should use consistent definitions and present exception counts alongside the total complaint volumes used to calculate the rates. If the investigation identifies a specific process, the next review should focus on that process instead of revisiting the overall percentage.
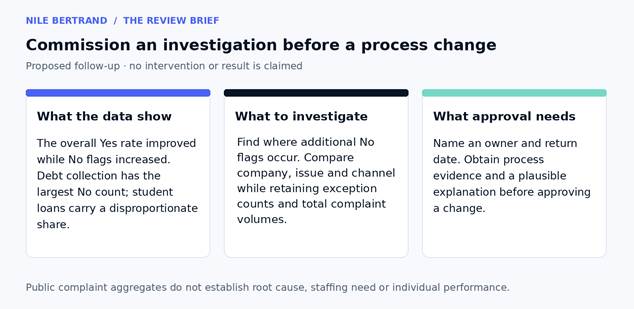
Figure 3. A proposed review brief, not a record of actions taken or outcomes achieved. The follow-up requires process evidence that this analysis does not supply.
The distinction between recorded status and delivered outcome is explored separately in the NYC311 closed-versus-resolved analysis. Here, the decision is narrower: where should a leader investigate when the aggregate result and the exception count point in different directions?
Aggregate complaint records cannot answer an individual performance question either. That boundary matters when an operational review starts drifting toward employee appraisal, a different discussion from development and coaching.
For the next KPI review, present the exception count alongside the percentage. If the rate has improved, assess whether total complaint volume changed, if exceptions became more concentrated, and whether the proposed action is supported by the evidence. Document the investigation and its owner before the meeting ends.
About the analysis
The unit is one complaint ID. A fresh saved-cell read of the source workbook found 478,794 distinct IDs, all received between January 1 and March 31, 2024. Independent SQL aggregation of the previously extracted rows reproduced every month–product–timeliness count and the response-category cross-tabulation. Both routes use the same saved source; they are not independent publisher downloads.
There are no missing timeliness flags. Seven complaints lack a company-response category and remain in the total complaint count used to calculate the rates. “Timely response?” marked No returns 2,042 records; the separate company-response category “Untimely response” returns 272. Those fields are not interchangeable.
All rates use summed counts, not averages of product percentages. Displayed percentages are rounded to two decimals. The calculations are descriptive, not a test of statistical process stability or proof of causation. The original download date, upstream filter history, and completeness against the publisher’s database remain unverified. Changes in record maturity could affect comparisons, so this saved snapshot cannot by itself establish operating improvement.
Source workbook: Consumer_Complaint_Q1_2024.xlsb. The accompanying claim ledger and validation report document the calculations without distributing individual complaint records.
Sources
[1] Consumer Financial Protection Bureau — Consumer Complaint Database
[2] Consumer Financial Protection Bureau — Consumer Complaint Database API: field reference
[3] Andrew Likierman, Harvard Business Review (October 2009) — The Five Traps of Performance Measurement
Related reading
What Census AI Data Can Tell You About Choosing a First Workflow