

A request may exit the queue before the work is completed, or because it was a duplicate, misrouted, or described a condition not found during inspection. These are distinct operational events, yet a single “closed” total combines them.
This distinction is important when closure metrics are used as performance targets. The metric may reflect a system transition but not address the underlying business question.
NYC’s own reporting FAQ makes the boundary explicit: Average Days to Close measures the interval between receipt and the agency marking a request closed—not the actual time taken to fulfill the request.[1] The dataset’s Resolution Description field is similarly bounded: it describes the last action and may include next or future steps.[3]
To illustrate this, I analyzed a group of NYC311 requests created during a defined period. The goal is not to judge an agency, but to provide a clearer approach to performance review.
What this NYC311 response time analysis measures
The analysis covers 8,027 unique requests assigned to the Department of Transportation with complaint type Street Condition, created from September 1 through September 30, 2026. It uses the current-state extraction acquired on October 31, 2026, not a reconstructed history of every status change.[2]
The query included all requests, regardless of closure status. All group records remain in the denominator, including those without valid closure timestamps. Publisher timestamps without a specified zone were treated as America/New York.
At that cutoff, the group separates into:
- 7,443 requests with valid closure timestamps: closure is at or after creation and no later than the cutoff.
- 581 requests not closed at the cutoff.
- 3 records with closure timestamps preceding creation: retained in the group but excluded from valid-duration calculations.
These categories total 8,027. They represent a timestamp-validity bridge, not just a count of records labeled “Closed.” Of these, 7,446 records have the “Closed” label; invalid dates account for the lower valid-closure count.[2]
This analysis covers a single complaint type, one agency, and one created-month group. It does not represent a citywide service score, team comparison, or resident satisfaction metric.
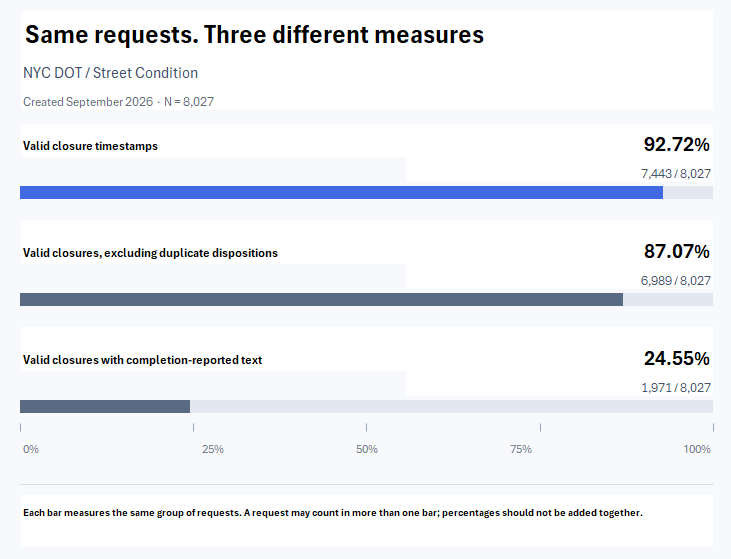
The same set of requests supports different interpretations, each with limits.
Of all 8,027 requests, 7,443 have valid closure timestamps (92.72%). But 454 of those valid closures have a narrative explicitly describing the request as a duplicate.[2]
For a sensitivity check, exclude duplicate dispositions from the closure numerator while keeping the full group denominator. This yields 6,989 / 8,027, or 87.07%.[2]
This is not a fully deduplicated request rate. No request IDs were removed from the dataset or denominator, and the analysis does not identify all underlying street problems or link each duplicate to an original. The focus is narrower: how does the reported share change when duplicate dispositions are excluded from the closure numerator? DOT / Street Condition requests created September 2026; snapshot cutoff October 31, 2026. Every bar uses denominator 8,027. Bars overlap and must not be added. Duplicate removal changes only the numerator. “Completion reported” is an analyst-coded narrative category among valid closures—not independently verified repair or fulfillment.
The chart also shows 1,971 of 8,027 requests, or 24.55%, with valid closures and narratives explicitly reporting completion.[2] This category includes text indicating the problem was repaired, found fixed, or the request was completed or the condition corrected. It excludes temporary-repair language and ambiguous “resolved or provided information” language, following the published coding rules.
Do not interpret 24.55% as the fulfillment rate. The narratives are not independently verified, and other categories may reflect legitimate work, correct administrative decisions, activity tracked elsewhere, or outcomes not captured in this extract. The difference between the bars does not indicate failure or unfinished service, and an open record does not prove that no work occurred.
The key finding is that interpreting a closure KPI depends on which dispositions are included in the metric and the decision it is intended to support.
Read the disposition before judging the speed
The codebook classifies narrative texts using ordered rules. Duplicate language takes precedence, temporary repairs are separate from completion reported, and references to future projects or other maintenance systems are not considered evidence of completed repair. These are analytical categories, not an official NYC outcome taxonomy.
Among the 7,443 valid closures, coded narratives include 1,652 routed or referred requests, 1,171 where the problem was not found, and 77 reporting temporary repairs.[2] These counts reflect text in the extract, not independently observed field conditions. The full disposition bridge and rules are available for audit, rather than being summarized under a single “resolved” label.
A referral, closing a duplicate, or determining that a reported condition meets the standard can each be appropriate actions. Performance reviews should not automatically treat these as failures, nor count them as completed repairs without further evidence.
In a cross-functional workflow, ask whether the receiving owner accepted the handoff and where the outcome will be recorded. This dataset cannot answer that for every request, but your own service process may provide this information if the evidence is documented.
Faster closure is not automatically faster delivery
For the 7,443 valid closure pairs, mean elapsed time is 69.72 hours, and the median is 39.94 hours. Excluding duplicate-request dispositions leaves 6,989 pairs, with a mean of 74.14 hours and a median of 43.99 hours.[2]
This change does not show that duplicates have led to better performance or that an agency is efficient. It demonstrates that the measured population affects results. Timing statistics can shift when the disposition mix changes, even before any change in delivered outcomes is proven.
The 584 records without a valid closure pair—the 581 not closed and 3 with invalid dates—are excluded from duration summaries. They are not treated as zero-hour closures and remain part of the cohort.[2]
Keep aging separate from completed-record timing
The 581 open records have a median age of 44.32 days at the cutoff.[2] This reflects elapsed time since creation, not the remaining time to repair, an SLA breach, or proof that the underlying condition is unresolved.
A backlog dashboard should therefore keep at least two views apart:
- Timing for records with valid closure pairs, with the included dispositions stated.
- Age and next action for records still not closed, with a visible extraction date.
Do not combine closed durations and open ages into a single “average resolution time,” as they represent different observations. Avoid inferring trends from a single snapshot. Tracking transitions or reopenings requires a suitable event history or repeated, controlled snapshots.
A decision framework for closed vs resolved tickets
The key takeaway is not to abandon closure metrics, but to avoid expecting one metric to represent multiple outcomes.
Define the decision before the dashboard
State the review question in plain language. Are you managing administrative throughput, verifying completed service, or identifying work that needs an owner? Each requires a different evidence standard.
For administrative throughput, a valid closure timestamp may suffice. For fulfilled service, require evidence linked to the requested outcome. For handoffs, define acceptance by the receiving owner. These are suggested workflow controls, not claims about what the NYC extract demonstrates.
Publish a metric contract
Before approving a KPI, document:
- Population: which group or intake population is included, and why?
- Numerator: what exact event qualifies, including duplicate and referral rules?
- Denominator: do all requests remain, or are exclusions changing the population?
- Clock: what starts and stops elapsed time, in which time zone?
- Evidence: is the outcome verified, reported in text, or unavailable?
- Exceptions: where do missing dates, invalid dates, and uncertain dispositions appear?
- Ownership: who reviews ambiguous cases, and who owns the next action?
Keep the metric contract with the chart. If readers must review transformation code to learn that “resolved” means “marked closed,” the presentation is over-interpreting for them.
Match the response to the evidence
If a closure target is met but fulfillment evidence is missing, report the closure result and the evidence gap separately. Do not label the gap as failed service.
If referrals make up a significant part of your queue, review handoff acceptance and downstream tracking before concluding the originating team should work faster. If missing or invalid dates affect the metric, assign a data-quality owner instead of silently excluding them.
If aging work requires intervention, prioritize locally validated factors such as urgency, commitments, and impact, rather than age alone. The public dataset does not define appropriate thresholds or resource allocation for other organizations.
Finally, review a small, carefully selected sample across key dispositions. Compare the label, recorded action, and evidence required for the business decision. The goal is not a more complex dashboard, but one whose labels can answer a direct question: what happened, and what do we know?
What this study cannot settle
This snapshot cannot reconstruct a complete request lifecycle, independently verify repairs, estimate all unmet service needs, or determine why a request took longer. Agency and complaint-type boundaries are significant. Narrative coding involves judgment, and a last-action description may reference information outside the extract.[3]
The analysis does not support a sector diagnosis, agency ranking, or causal staffing recommendation. It serves as a reproducible example of metric-definition sensitivity, not a universal closure benchmark.
Bring one metric to the next review
Before the next performance meeting, select one KPI currently labeled “resolved.” Bring its numerator, denominator, stopping event, and accepted outcome evidence. Then confirm whether the label matches what the system records.
If you would like to discuss that metric definition, please reach out through my contact page.[4] Share a nonconfidential description of the decision and what a useful next step would be. Exclude employer, client, customer, and infrastructure details from your message. A clear question is a good starting point, rather than a data dump.
Method and reproducibility notes
All study figures are based on the frozen original NYC response, not competitor analyses. The evidence package includes the exact source query, before- and after-count responses, source hashes, date, narrative coding rules, tidy data, workbook, and calculation ledger. Numeric claims are mapped individually in article-claim-map.csv to the ledger and source scope. Re-running the live query later may return changed records; use the frozen bytes to reproduce these results.
The full raw bodies are retained for private audit and may contain publisher address fields. They are not intended as a public download. This article contains aggregate results only.
Sources
[3] NYC311 dataset field metadata
Related reading
More articles are taking shape.